
GPA to Percentage: The Formula, the Catch, and Why Your Number Might Be Wrong
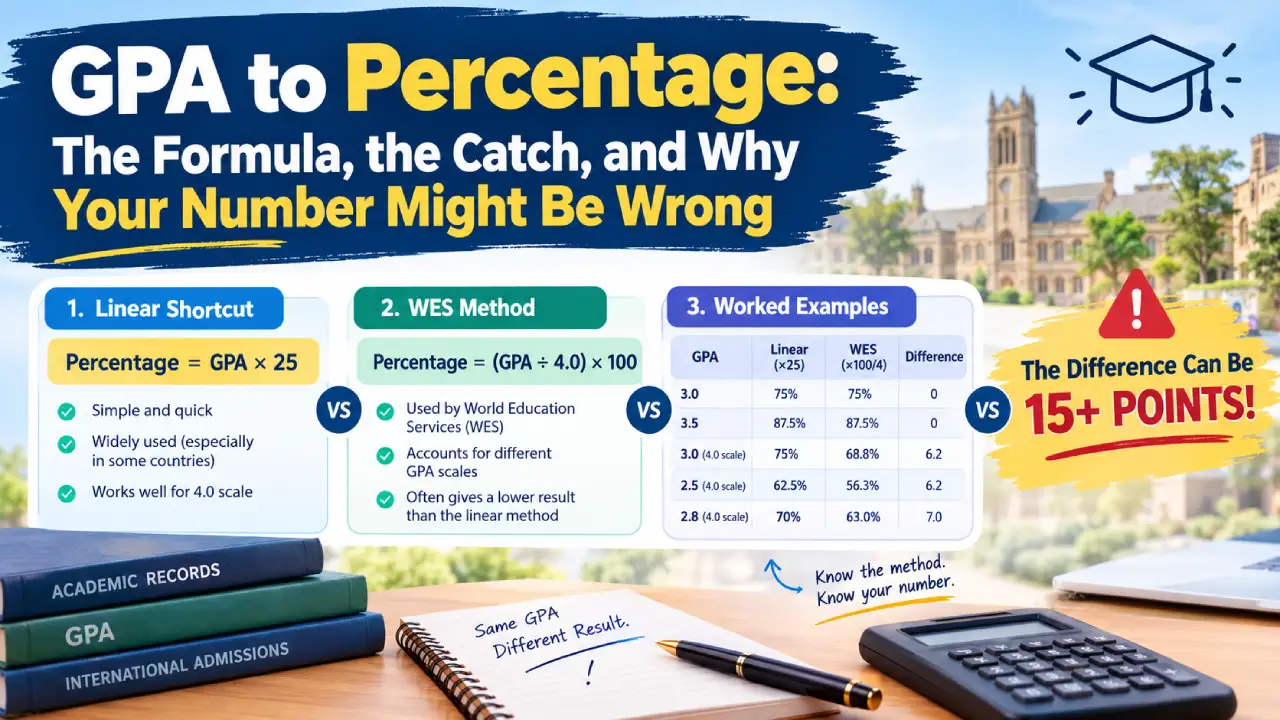
Here’s the catch almost nobody tells you: converting GPA to percentage isn’t one calculation; it’s dozens of different ones, and picking the wrong one can cost you a scholarship or an application slot. On the common US 4.0 scale, a rough linear formula is Percentage = (GPA ÷ 4) × 100, so a 3.5 GPA lands near 87-88%. But credential evaluators like WES don’t use that shortcut at all. They map each course grade to a published percentage band first, then average. Your real answer depends entirely on whose scale you’re matching: your school’s, a credential evaluator’s, or a receiving country’s. Use the shortcut to get oriented. Use the published table when a decision rides on the number.
Quick facts
| Simple linear formula | GPA to percentage = (GPA ÷ 4) × 100 |
| WES method | Band-based, not a single multiplier |
| Common US grading, A | 93-96% on one widely cited scale |
| Common US grading, A- | 90-92% |
| Common US grading, B+ | 87-89% |
| A 3.5 GPA, roughly | 87-90%, depending on the method |
| Formula that’s accepted everywhere | Doesn’t exist |
Why this question has no clean answer
Picture two students. Both finish with a 3.5 GPA. One applied the simple formula and told a recruiter they scored 87.5%. The other had their transcript run through WES and came out around 90%, because WES mapped their actual letter grades to percentage bands instead of dividing by 4.
Same GPA. Different percentage. Neither student lied. They just used two different systems that happen to share the same input number.
That’s the trap with GPA-to-percentage conversion. A 4.0 scale was never designed to be percentage. It’s a compressed code, four major steps standing in for a hundred possible scores. Squeezing it back out into a percentage requires a rule, and the rule changes depending on who’s asking and why.
The simple linear formula, and what it hides
If you need a rough estimate, this is the fastest route:
Percentage = (GPA ÷ maximum GPA on your scale) × 100On a standard 4.0 scale:
A 3.5 GPA → (3.5 ÷ 4) × 100 = 87.5%.
A 3.8 GPA → (3.8 ÷ 4) × 100 = 95%.
Quick, clean, and wrong in one important way: it assumes GPA sits on a straight line from 0 to 100%, with no floor. In reality, most US institutions treat anything below roughly 60% as failing, not 0%. The linear formula compresses a passing range of roughly 60-100% into a GPA range of 0-4.0, so it systematically overstates how low a “low GPA” really is in percentage terms, and understates how much separates a 3.9 from a 4.0.
Treat this formula the way you’d treat a rough currency conversion at an airport kiosk: useful for a gut check, not for signing a contract.
What institutions actually publish
Real grading scales aren’t linear. They’re banded, and the bands aren’t even. Here’s a widely cited version of the common US scale:
| Letter | Percentage | GPA |
|---|---|---|
| A+ / A | 97-100% / 93-96% | 4.0 |
| A- | 90-92% | 3.7 |
| B+ | 87-89% | 3.3 |
| B | 83-86% | 3.0 |
| B- | 80-82% | 2.7 |
| C+ | 77-79% | 2.3 |
| C | 73-76% | 2.0 |
| C- | 70-72% | 1.7 |
| D+ | 67-69% | 1.3 |
| D | 65-66% | 1.0 |
| F | Below 65% | 0.0 |
This table comes from a training reference published by World Education Services (WES), the credential evaluator many international applicants and employers rely on. Notice the gaps. A full letter grade like B spans only four percentage points, 83 to 86, while the failing range below D swallows everything from 0 to 64. That lopsided spread is exactly why dividing GPA by 4 and multiplying by 100 breaks down at the low end.
Your own school’s table will likely look similar but not identical. One Canadian university’s published bands list a B+ as 77-79% rather than 87-89%, a full ten points lower for the same letter. A Taiwanese university’s official scale gives A+ a 4.3, not 4.0, which changes every calculation downstream. There is no universal spread. There’s only your institution’s spread, and whichever other institution’s spread you’re being asked to match.
Worked example 1: the fast way
Suppose your cumulative GPA is 3.6 on a standard 4.0 scale, and a form just wants a ballpark percentage for a quick filter, not an official record.
Percentage = (3.6 ÷ 4) × 100 = 90%.
Done in five seconds. Fine for a self-assessment, a LinkedIn summary, or a casual conversation. Not fine for anything that will be checked against your transcript.
Worked example 2: the band-based way
Now suppose that same GPA came from these five courses, each one credit-weighted equally for simplicity.
| Course | Letter grade | GPA points | Percentage band (midpoint used) |
|---|---|---|---|
| Calculus II | A- | 3.7 | 91% |
| Organic Chemistry | B+ | 3.3 | 88% |
| World History | A- | 3.7 | 91% |
| Statistics | B | 3.0 | 84.5% |
| English Seminar | A | 4.0 | 94.5% |
Step 1: Confirm the GPA: (3.7 + 3.3 + 3.7 + 3.0 + 4.0) ÷ 5 = 17.7 ÷ 5 = 3.54, close enough to our 3.6 example.
Step 2: Average the percentage midpoints instead of the GPA: (91 + 88 + 91 + 84.5 + 94.5) ÷ 5 = 449 ÷ 5 = 89.8%.
Compare the two answers: the linear shortcut on 3.54 GPA gives (3.54 ÷ 4) × 100 = 88.5%. The band-based average gives 89.8%. They’re close here because the grades cluster tightly near the top of the scale, but they diverge fast once a transcript has more spread, especially if a C or D grade enters the mix, because the linear formula treats every GPA point as worth exactly 25 percentage points, when real bands don’t.
Worked example 3: where the two methods really split
Take a lower, more mixed transcript: a 2.3 GPA built from a C+, a C, a C-, and a D+.
Linear shortcut: (2.3 ÷ 4) × 100 = 57.5%.
Band-based estimate, using the midpoints from the table above (C+ 78%, C 74.5%, C- 71%, D+ 68%): (78 + 74.5 + 71 + 68) ÷ 4 = 291.5 ÷ 4 = 72.9%.
That’s a 15-point gap on the same transcript. If a scholarship cutoff sits at 65%, the linear formula says you missed it. The band-based method says you cleared it comfortably. This is not a rounding error. It’s the direct result of the US grading scale bunching most passing grades into a narrow 65-100% window while GPA spreads them evenly from 1.0 to 4.0. The lower your GPA, the more these two methods disagree, and the more it matters which one the person reading your number actually uses.
Why WES and similar evaluators don’t just divide by 4
Credential evaluators exist precisely because institutions and countries don’t share one scale. WES’s own description of its process is a three-step one: map the academic system, convert each course grade to a US-equivalent letter and point value using that system’s norms, then calculate a credit-weighted average from those points, not from a blanket formula applied to an overall percentage or CGPA. This is also why a course-by-course evaluation looks at individual subjects rather than a single aggregate number. An 8.5 CGPA from a 10-point Indian system, for instance, does not simply become 8.5 ÷ 10 × 4.0 on a US scale, because the underlying grading philosophy differs from a straight percentage mapping.
The practical lesson: if an application specifically asks for a WES, NUFFIC, or other formal evaluation, a formula you calculated yourself will not substitute for it, no matter how carefully you did the math.
Where this matters most
Study-abroad and immigration applications: Several processes require a formal credential evaluation rather than a self-reported percentage, precisely because self-converted numbers vary so widely.
Job applications with percentage cutoffs: If a company screens for “60% or above,” and you report a self-calculated linear conversion of a low GPA, you may misstate your own standing in either direction.
Comparing yourself to a published cutoff: A scholarship that requires “75% or equivalent” is implicitly relying on some conversion table. Find out which one before assuming your GPA clears or misses it.
Transferring between institutions in different countries: Your receiving institution, not a generic online calculator, decides which number counts.
Common mistakes
- Treating the linear formula as universal: It’s a rough estimate, not a published standard, and it gets progressively less accurate the lower the GPA.
- Assuming every school uses the same percentage bands: A B+ can mean 87-89% at one school and 77-79% at another.
- Skipping the credential evaluator when one is required: A self-made conversion doesn’t satisfy a requirement for a WES or equivalent report.
- Mixing GPA scale: A 3.5 on a 4.0 scale and a 3.5 on a 4.3 scale (where A+ tops the chart) are not the same achievement.
- Reporting a converted percentage without saying how you got it: A number with no stated method invites a reviewer to assume the wrong one.
- Using this for CGPA on a 10-point scale: That’s a different conversion entirely, covered in our CGPA to Percentage guide.
How to get the number that actually matters
- Check what the receiving form or institution requires. Some explicitly want a self-reported estimate; others require a formal evaluation.
- Pull your own institution’s published percentage bands, not a generic online table, if you need your own school’s equivalent.
- Use the linear formula only for a quick personal estimate, and label it as an estimate if you share it.
- For international applications, check whether a WES, NUFFIC, or similar evaluation is required, and budget time for that process rather than relying on self-calculated numbers.
Try the calculator
Use our College GPA Calculator to work out your GPA first, since every conversion method starts there. If you’re converting a CGPA from a 10-point scale instead, see CGPA to Percentage and Percentage to CGPA.
Related guides
- What Is GPA? Complete Guide to Grade Point Average
- GPA Scale: Letter Grades, Grade Points, and Percentages
- Percentage to GPA: Formula and Examples
- CGPA to Percentage: Formula, Examples, and Why There’s No Single Answer
- United States Grading System and GPA Guide
The one number to remember
Every method in this guide agrees on one thing: a GPA-to-percentage conversion is only as good as the table behind it. The linear formula is a napkin estimate. WES-style band mapping is what actually gets checked. The gap between them grows the lower your GPA sits, which is exactly when getting it right matters most.
So before you write a percentage anywhere official, ask one question: whose scale is this for? Answer that first, and the math takes care of itself.