
Percentage to GPA: The Formula Colleges Actually Use (Not the One You’d Guess)
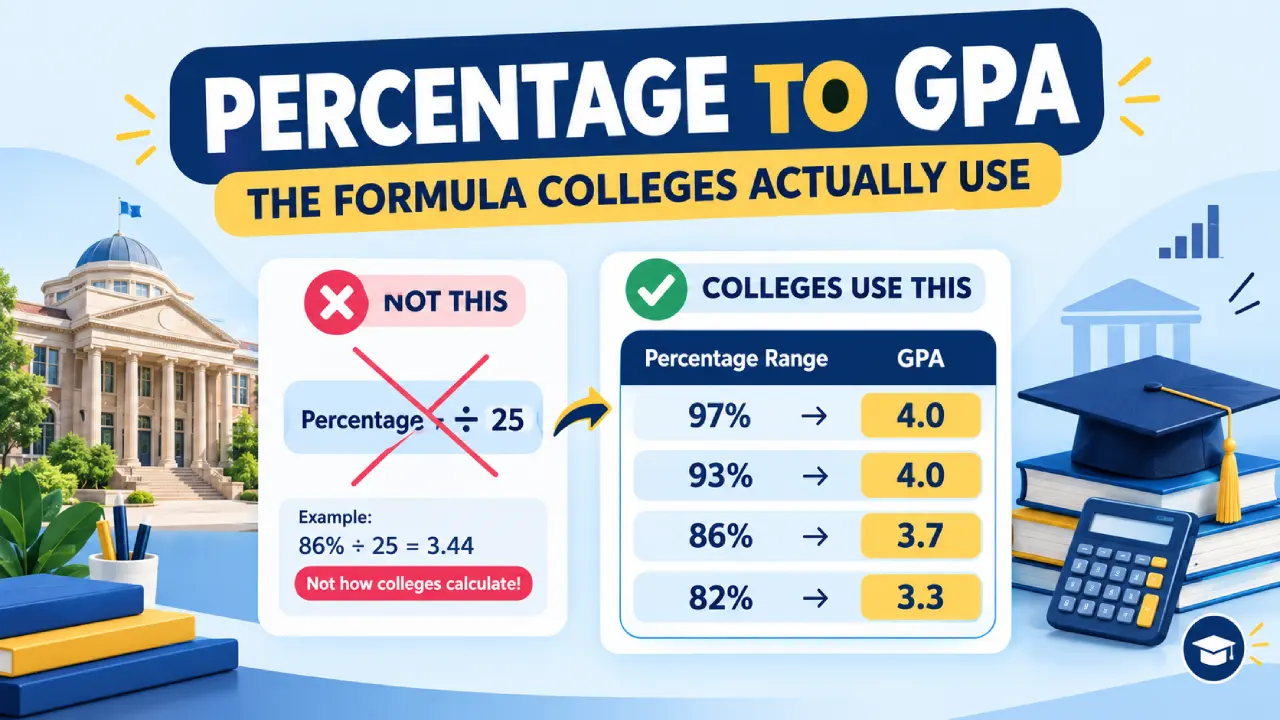
Most students guess that percentage to GPA is a straight division problem: take your percentage, divide by 25, done. That guess is wrong more often than it’s right. Admissions offices and most US schools don’t use a straight line at all. They use banded tables, where a 97% and a 93% both round to the same 4.0, but an 86% and an 82% land a full third of a point apart. The simple linear formula, GPA = (Percentage ÷ 100) × 4, gets you a rough number fast. The banded method, built on how US letter grades actually work, is the one colleges, scholarship committees, and most GPA calculators use when a real decision is on the line.
Quick facts
| Linear shortcut | GPA = (Percentage ÷ 100) × 4 |
| Banded method (standard US scale) | 93–96% → 4.0, 90–92% → 3.7, 87–89% → 3.3, and so on |
| A 90% under the linear formula | 3.6 |
| A 90% under the banded method | 3.7 |
| An 85% under the linear formula | 3.4 |
| An 85% under the banded method | 3.0 |
| One formula that fits every school | Doesn’t exist |
Why your gut-check formula is probably lying to you
Try this. Take 85%. Run it through the simple division formula: (85 ÷ 100) × 4 = 3.4. Now check it against a standard US grading band. 85% sits inside the B range, 83–86%, which converts to a 3.0.
That’s not a rounding difference. That’s the gap between a solid B and a borderline A-. If a scholarship cutoff sits at “3.3 GPA or above,” the linear formula tells you that you cleared it. The banded method, the one your school’s registrar and most admissions offices actually use, tells you that you didn’t.
This happens because US grading bands aren’t evenly spaced across the percentage scale. A single letter grade, like B or B+, might span only three or four percentage points, while the top grade, A, can span a much wider band from 93% all the way to 100%. A linear formula assumes every percentage point is worth the same fraction of a GPA point. Real grading scales don’t work that way, and the mismatch gets worse the further you are from either end of the scale.
The linear shortcut, and when it’s fine to use
For a fast mental estimate, this is the formula:
GPA = (Percentage ÷ 100) × maximum GPA on your scaleOn a 4.0 scale:
A 92% → (92 ÷ 100) × 4 = 3.68.
A 78% → (78 ÷ 100) × 4 = 3.12.
Use this for a gut check, a rough self-assessment, or when you genuinely just want a ballpark number in a casual conversation. Don’t use it for anything a reviewer might cross-check against your actual transcript or against a published conversion chart, because it won’t match either one.
The banded method: what your transcript actually follows
Here’s a widely cited version of the standard US unweighted grading scale, the one multiple college-admissions and GPA-reference sources converge on:
| Percentage | Letter grade | GPA |
|---|---|---|
| 97–100% | A+ | 4.0 |
| 93–96% | A | 4.0 |
| 90–92% | A- | 3.7 |
| 87–89% | B+ | 3.3 |
| 83–86% | B | 3.0 |
| 80–82% | B- | 2.7 |
| 77–79% | C+ | 2.3 |
| 73–76% | C | 2.0 |
| 70–72% | C- | 1.7 |
| 67–69% | D+ | 1.3 |
| 65–66% | D | 1.0 |
| Below 65% | F | 0.0 |
Notice the two things that make this different from a straight line. First, A+ and A both top out at 4.0, which means a 97% and a 100% score identically, something the linear formula would never do, since it would give them 3.88 and 4.0 respectively. Second, the failing band at the bottom swallows everything below 65%, so a 40% and a 60% both convert to a flat 0.0 under this method, while the linear formula would still spread them out to 1.6 and 2.4.
Your own school’s table may shift these numbers by a point or two in either direction, and that’s normal. The core lesson doesn’t change: the real conversion is a staircase, not a ramp.
Worked example 1: the fast way
A student has a percentage average of 88% and needs a rough number for a quick self-assessment, not an official record.
GPA = (88 ÷ 100) × 4 = 3.52.
That took five seconds, and it’s a reasonable ballpark. It’s just not what the transcript will say.
Worked example 2: the banded way, course by course
Now take a more realistic case: five courses, each with its own percentage grade.
| Course | Percentage | Band | GPA |
|---|---|---|---|
| Biology | 91% | A- | 3.7 |
| Algebra II | 88% | B+ | 3.3 |
| World Literature | 95% | A | 4.0 |
| Spanish III | 84% | B | 3.0 |
| Physical Education | 79% | C+ | 2.3 |
Step 1: Convert each percentage using the band table, as shown above.
Step 2: Average the GPA values. (3.7 + 3.3 + 4.0 + 3.0 + 2.3) ÷ 5 = 16.3 ÷ 5 = 3.26.
Compare to the linear shortcut on the same average percentage. The five percentages average to (91 + 88 + 95 + 84 + 79) ÷ 5 = 87.4%. Run that through the linear formula: (87.4 ÷ 100) × 4 = 3.50. The banded method gives 3.26. The linear formula gives 3.50. That’s a quarter-point gap, large enough to matter for a scholarship or honor-roll cutoff, and it comes entirely from the difference in method, not from any error in arithmetic.
Worked example 3: the gap widens at the extremes
Take a student with a 96% average built from two A’s (95% and 97%).
Linear formula: (96 ÷ 100) × 4 = 3.84.
Banded method: both grades fall at or above 93%, so both convert to a 4.0, and the average is a flat 4.0.
Here the banded method actually helps the student, turning two excellent but not-quite-perfect scores into a full 4.0, something the linear formula would never allow. This cuts both ways. Near the top of the scale, banding is forgiving. Near the bottom, as worked example 2 showed, banding can be unforgiving, because a single grade near a band’s floor gets no partial credit for the percentage points above it within that band.
Why colleges recalculate your GPA at all
If your high school already reports a GPA, why would anyone convert your percentage separately? Because thousands of high schools grade differently, some are percentage-only, some use different weighting scales, some inflate grades more than others, and admissions offices need one consistent yardstick to compare applicants fairly. Recalculating everyone onto the same unweighted 4.0 scale, using bands rather than a raw percentage-to-decimal formula, is how that comparison happens. This is also why your school-reported GPA and a college’s “recalculated GPA” can differ, even when neither number is wrong. They’re answering different questions with different rules.
Weighted grades complicate this further
Everything above assumes an unweighted conversion, where every course counts the same regardless of difficulty. If your percentage came from an Honors or AP course, your school may add extra weight, commonly half a point for mid-level advanced courses and a full point for the highest tier, before or after the percentage-to-GPA step. That weighted number is not comparable to the unweighted bands in this guide. See our Weighted vs Unweighted GPA guide for how that layer works, since mixing it into a percentage conversion without accounting for weighting will overstate or understate your real standing.
If your percentage comes from outside the US
Percentage grading outside the US doesn’t map onto these bands at all. A university grading system built around a different pass mark, a different top-of-scale definition, or a different approach to what counts as excellent will produce a different, often lower-looking percentage for the same underlying performance. If you’re converting a percentage from India, Pakistan, or another system into a US-style GPA for an application, check whether the receiving institution requires a formal credential evaluation rather than a self-converted number. See our CGPA to Percentage and Percentage to CGPA guides for how those systems’ own conversions work, since they follow different rules entirely from the US bands in this article.
Common mistakes
- Applying the linear formula when a reviewer expects the banded one: The two methods can disagree by a quarter-point or more on the same transcript.
- Assuming every school’s bands match this table exactly: They’re close at most US schools, but confirm your own school’s published scale when it matters.
- Mixing weighted and unweighted numbers: A weighted percentage-derived GPA and an unweighted one answer different questions and shouldn’t be compared directly.
- Treating a self-converted GPA as official: Colleges that recalculate GPA will do so with their own method, which may not match either formula in this guide.
- Using a US conversion table on a non-US percentage: The grading philosophy, not just the numbers, differs between systems.
- Rounding mid-calculation: Average the exact GPA values first, then round the final result, not each course along the way.
How to land on the number that actually counts
- Find out who’s asking and why: A quick personal estimate tolerates the linear formula; an official application usually doesn’t.
- Pull your own school’s grading scale, not a generic chart, whenever the stakes are real.
- Separate weighted from unweighted before converting, so you’re not blending two different numbering systems into one GPA.
- For international percentages headed into a US-style application, check whether a formal credential evaluation is required before relying on any formula in this guide.
The number that doesn’t change
Strip away every formula in this guide and one fact remains constant: a percentage and a GPA are two different languages describing the same performance, and translation always loses something. The linear shortcut is fast but flattens the scale. The banded method matches reality but can be unforgiving at the edges of a letter grade. Neither one replaces your actual transcript.
So treat every converted number as a translation, not an original. Use it to get oriented, then go find the real document, your school’s grading scale or your transcript, before you let a converted GPA make a decision for you.
Try the calculator
Use our College GPA Calculator or High School GPA Calculator to work with your actual letter grades instead of a single averaged percentage. If you’re going the other direction, see GPA to Percentage.
Related guides
- GPA to Percentage: The Formula, the Catch, and Why Your Number Might Be Wrong
- GPA Scale: Letter Grades, Grade Points, and Percentages
- Weighted vs Unweighted GPA: What Colleges Look At
- What Is GPA? Complete Guide to Grade Point Average
- CGPA to Percentage: Formula, Examples, and Why There’s No Single Answer